7 Essential UX Analytics Metrics for Higher Conversion Rates
UX analytics helps businesses understand user behavior and improve digital experiences. By tracking the right metrics, you can make data-driven decisions to enhance engagement and increase conversions. Here are the key metrics to focus on:
-
Bounce Rate: Measures the percentage of users leaving after visiting one page. Lowering it increases engagement.
-
Session Duration: Tracks how long users stay on your site. Longer sessions indicate better content engagement.
-
Pages Per Session: Reflects user navigation patterns. Higher numbers show effective site structure and content relevance.
-
Conversion Rate: The percentage of visitors completing desired actions like purchases or sign-ups. A critical metric for success.
-
Click-Through Rate (CTR): Tracks how often users interact with elements like links and buttons. Higher CTR indicates better design and relevance.
-
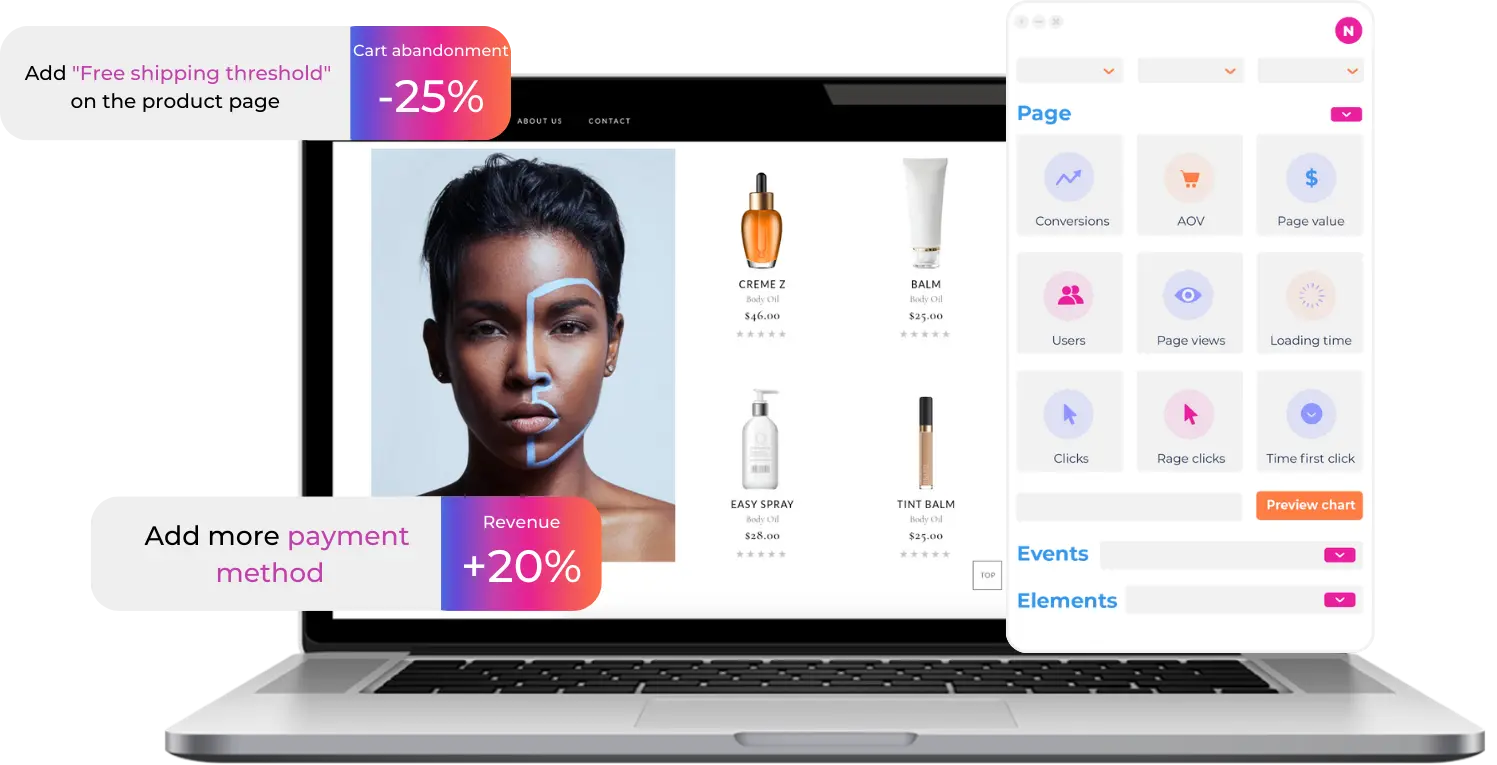
Cart Abandonment: Identifies issues during checkout. Reducing abandonment can recover significant revenue.
-
Task Completion: Measures how effectively users achieve their goals. High success rates signal good usability.
Quick Comparison Table
| Metric | What It Tracks | How It Impacts Conversions |
|---|---|---|
| Bounce Rate | Users leaving after one page | Lower bounce rates mean better engagement. |
| Session Duration | Time spent on site | Longer sessions indicate engaging content. |
| Pages Per Session | Number of pages visited per session | Higher PPS shows smooth navigation. |
| Conversion Rate | Visitors completing actions | Directly ties to revenue and success. |
| Click-Through Rate | User interaction with site elements | Reflects design and content effectiveness. |
| Cart Abandonment | Users leaving during checkout | Reducing it boosts sales. |
| Task Completion | Success in achieving user goals | High rates indicate better usability. |
The 7 Metrics in Google Analytics
1. Bounce Rate: Understanding User Exit Points
Bounce rate reflects the percentage of users who leave after visiting just one page, pointing to potential engagement problems that could impact conversions.
Understanding Bounce Rate Basics
Bounce rate tracks how many visitors leave your site after viewing only one page [2]. While the ideal rates differ by industry, knowing your site's benchmark is key:
| Industry | Average Bounce Rate |
|---|---|
| E-commerce/Retail | 20-45% |
| B2B (Software/Manufacturing) | 70% |
| Travel/Hospitality | 43% |
Here's a stark reminder: 49% of users will leave a page if it takes longer than two seconds to load [4]. Even a small delay - just 500 milliseconds - can frustrate users by 26% and reduce engagement by 8% [3].
How to Lower Your Bounce Rate
To reduce bounce rates, focus on improving speed, aligning content with user intent, optimizing for mobile, and enhancing visual appeal.
-
Speed Optimization: Speed matters - a lot. Nearly half of users expect pages to load in two seconds or less [3]. Compress images, use faster hosting, and enable browser caching to keep load times short.
-
Content Relevance: Make sure your page content and meta descriptions match what users are searching for. Highlight key details like pricing, product specs, return policies, and user reviews right up front.
-
Mobile Responsiveness: Mobile devices have dominated web traffic since 2020 [4]. Ensure your site works seamlessly on all screen sizes, from smartphones to tablets.
-
Visual Engagement: Use clear fonts, logical hierarchies, eye-catching visuals, and well-structured headers to keep users interested and engaged.
2. Session Duration: How Long Users Stay
Session duration measures how long users interact with your site and can offer insights into how engaging your content is. According to Google Analytics benchmarks, a typical session duration ranges between 2–4 minutes [7], though this varies depending on the industry.
Understanding Session Duration Data
Here’s a breakdown of median session durations across different industries:
| Business Type | Median Session Duration |
|---|---|
| B2B Companies | 77.61 seconds [9] |
| B2C Companies | 92.33 seconds [9] |
| Gaming/Entertainment | 5+ minutes [5] |
| E-commerce | 2–3 minutes [11] |
Henry Cipolla, CTO of Localytics, states: "Session length is not the only metric for measuring engagement, but it is one that really matters" [5].
In GA4, a session is considered "engaged" if it lasts beyond a set time (10–60 seconds), involves more than one pageview, or triggers a conversion event [6].
Let’s look at ways to increase session duration on your site.
Strategies to Increase Session Duration
Improve Content Structure
Use a hub-and-spoke model for organizing content. Break up text with subheadings and short paragraphs to make it easier to read [9].
Add Interactive Features
Encourage users to stay longer by incorporating interactive elements such as:
Boost Technical Performance
A slow website can drive users away - 53% of visitors leave if a page takes more than three seconds to load [10]. Here’s how to improve site performance:
-
Use a CDN (Content Delivery Network)
-
Compress images and minimize scripts
-
Enable browser caching
-
Ensure mobile responsiveness [8]
Regularly compare your session duration data with industry benchmarks and your own historical trends to spot areas for improvement. Tools like session recordings and on-site surveys can help you understand user behavior and identify why visitors might leave [6]. Tailor your session duration goals to fit your website’s objectives.
3. Pages Per Session: Site Navigation Patterns
Analyzing Pages Per Session (PPS) offers valuable insights into how users interact with your site. PPS measures how many pages a visitor views during a single session, shedding light on user engagement and navigation - both critical for improving conversion rates.
What Pages Per Session Tells You
Here’s how PPS varies across different website performance levels:
| Website Performance Level | Pages Per Session |
|---|---|
| Top 10% of Websites | 5.2 pages |
| Top 20% of Websites | 4.0 pages |
| Average Websites | 2.6 pages |
| Bottom 20% of Websites | 1.7 pages |
For e-commerce sites, the average was 5.6 pages per visit in 2020, with users spending about 3 minutes and 56 seconds on-site [12]. Higher PPS often reflects smooth navigation, strong internal linking, and content that aligns with user needs.
Now, let’s look at how to improve these numbers.
Tips to Improve Page-to-Page Movement
-
Link Related Content: Build content clusters by linking related articles or product pages. This encourages users to explore more.
-
Simplify Your Layout: A clear, straightforward website structure makes it easier for visitors to move from one page to another.
-
Boost Content Visibility: Use internal links, prominent call-to-action buttons (CTAs), and an effective search bar to guide users to relevant content.
-
Optimize for Speed: Use tools like CDNs, compress images, enable caching, and ensure your site is mobile-friendly to improve load times.
-
Analyze User Behavior: Pay attention to how visitors interact with your site. Heavy reliance on the search bar might signal issues with your navigation menus or layout [1].
Improving these areas can make your site more engaging and encourage visitors to stay longer and explore further.
sbb-itb-b173e63
4. Conversion Rate: Measuring Success
Conversion rate is a key metric for evaluating how well your user experience (UX) turns visitors into customers or leads. It reflects the percentage of users who take specific actions, like making a purchase, signing up for a newsletter, or downloading content.
Key Conversion Rate Factors
A "good" conversion rate usually ranges from 2% to 5%, but this can vary by industry [13]. Several factors can make or break your conversion rate:
| Factor | How It Affects Conversion |
|---|---|
| Page Load Speed | A 2-second delay can double bounce rates [16] |
| Mobile Optimization | 77% of retail traffic comes from smartphones [15] |
| Visual Hierarchy | Users decide within 6–8 seconds whether to stay [16] |
| Form Complexity | Shorter forms lead to higher completion rates |
| Trust Signals | Social proof and security badges boost credibility |
With mobile devices driving two-thirds of online shopping orders [15], optimizing for mobile is no longer optional. Let’s dive into how you can improve these areas to see better results.
Methods to Increase Conversions
Here are practical ways to enhance your conversion rate:
-
Optimize Visual Layout
-
Use contrasting colors for calls-to-action (CTAs).
-
Follow the F-layout for content placement.
-
Incorporate white space to guide users' focus.
-
-
Streamline Your Conversion Funnel
"Site owners often make the mistake of not having a clear, single focus for the page. Landing pages should have one primary objective, whether it's capturing email addresses, getting sign-ups, or making a sale. When a page has too many distractions, including links, navigation options, or too much information, it can confuse visitors and decrease conversions. Keep the content blocks concise and relevant. Focus on a clear value proposition and be sure to place a consistent and action-oriented call to action prominently on your pages." [15]
-
Build Trust Through Design
-
Add customer reviews and testimonials.
-
Display security badges and certifications.
-
Offer money-back guarantees.
-
Include live chat support [17].
-
-
Monitor and Test Use analytics tools to track user behavior and test:
-
CTA placement and colors.
-
Form field arrangements.
-
Page layouts.
-
Checkout processes [14].
-
5. Click-Through Rate: Tracking User Actions
Click-through rate (CTR) measures how often users interact with elements like navigation links, banners, and search results. Like bounce rate and session duration, tracking CTR helps you understand user behavior and improve your site’s performance.
Measuring Click-Through Rate
To calculate CTR, divide the number of clicks by the number of impressions, then multiply by 100%. Here's how different elements typically perform:
| Element Type | Average CTR | Industry Benchmark |
|---|---|---|
| Navigation Links | 1.91% | Varies by position [23] |
| Banner Elements | 0.2–0.3% | 2% is considered high [18] |
| Search Results | 67% | For top 5 positions [22] |
To track CTR effectively, follow these steps:
-
Use Google Tag Manager (GTM) for tracking clicks [20].
-
Set up tracking for specific elements using CSS selectors [20].
-
Define success metrics tailored to each element [19].
Once you’ve gathered accurate data, focus on improving your CTR numbers.
Boost CTR
Penn Foster increased its site search CTR by 14% using targeted strategies [21]. Here’s how you can do the same:
-
Improve Visual Design
-
Use contrasting colors for clickable elements.
-
Place key calls to action (CTAs) above the fold.
-
Ensure buttons are easy to tap on mobile devices.
-
-
Make Content More Relevant
-
Match content to user search intent.
-
Write clear, descriptive anchor text for links.
-
Use action-driven language on button text.
-
-
Optimize Technical Aspects
-
Keep URLs short and descriptive.
-
Add rich snippets for better visibility in search results.
-
Write compelling meta descriptions (aim for ~105 characters) [21].
-
Use jump links for easier navigation in long content.
-
Did you know? About 43% of visitors go straight to the search bar when they land on a site [21]. Improving the search experience can significantly impact CTR. Here are some key areas to focus on:
| Optimization Area | Implementation Strategy |
|---|---|
| Search Experience | Monitor popular searches and create relevant content. |
| Navigation Flow | Build clear pathways to high-priority pages. |
| Mobile Layout | Make sure buttons and links are easy to tap. |
| Content Structure | Use a clean, organized layout for clickable items. |
6. Cart Abandonment: Resolving Checkout Issues
Cart abandonment is a big hurdle for e-commerce businesses. On average, 70.19% of online shoppers abandon their carts [25], leading to a staggering $18 billion in lost revenue every year [26].
Common Cart Abandonment Causes
Several issues during checkout often lead to cart abandonment:
| Reason for Abandonment | Percentage | Impact on User Experience |
|---|---|---|
| Extra costs (shipping, tax, fees) | 48% | Lack of price transparency |
| Account creation requirement | 26% | Adds friction to the process |
| Security concerns | 25% | Erodes customer trust |
| Slow delivery | 23% | Misaligned expectations |
| Complicated checkout | 22% | Poor usability |
Emil Kristensen, CMO and co-founder of Sleeknote, highlights the frustration: "…it's incredibly frustrating to successfully move a shopper through the sales funnel and create offers that are enticing enough to pique their interest, only to inevitably lose them at the point of purchase" [24].
Addressing these issues is key to improving sales and reducing cart abandonment.
How to Complete More Sales
To combat cart abandonment, successful businesses are taking these steps:
-
Streamline the Checkout Process
Ferryhopper, a ferry ticketing platform, saw improvements by introducing a Universal Checkout system and tailoring the process to fit regional needs. -
Be Transparent About Costs
Display all fees upfront, including shipping, taxes, extra charges, and any potential discounts. Surprises at checkout often lead to abandonment. -
Incorporate Trust Signals
With 18% of shoppers hesitant to share payment details on unfamiliar sites [27], adding trust-building elements is crucial. Consider:-
Security badges and certifications
-
Customer reviews and ratings
-
Clear return policies
-
Money-back guarantees
-
Real-time inventory updates
-
-
Improve Technical Performance
Sites with fast load times (0-2 seconds) see the best conversion rates [27]. Focus on speed, mobile optimization, error prevention, and real-time form validation. -
Use Recovery Tactics
Targeted recovery efforts can bring back lost sales. For instance, email campaigns sent within three hours of abandonment have a 40% open rate and a 20% click-through rate [28].
Banxa, a crypto infrastructure provider, recovered over $7 million in revenue by using processor fallback and A/B testing approval rates.
Continuously analyze your checkout process to identify and address friction points. This approach can significantly improve your conversion rates and overall revenue.
7. Task Completion: User Goal Achievement
Task completion plays a key role in driving conversions. When users fail to complete a task, they are five times less likely to return [30]. That’s why improving this metric is so important.
Tracking Task Success Rates
Task completion rates provide valuable insights into usability and user satisfaction. In many industries, a 78% task completion rate is considered a solid benchmark [1]. To monitor this effectively, focus on these metrics:
| Metric Type | What It Measures | Why It Matters |
|---|---|---|
| Success Rate | Completed tasks vs. total attempts | Shows how well users achieve their goals |
| Error Rate | Mistakes made during task completion | Highlights areas causing confusion |
| Time on Task | Time taken to complete a task | Indicates how efficient the process is |
These metrics help pinpoint obstacles in the user journey, making it easier to address them.
"Task completion is the fundamental usability metric. If users can't accomplish what they're trying to do, not much else matters."
– Jeff Sauro, PhD [30]
Making Tasks Easier to Complete
Once you’ve measured task success, the next step is removing the barriers that prevent users from completing their goals.
-
Watch for Frustration Signals
Look for signs like rage clicks on non-functional elements, erratic cursor movements, abandoned forms, or excessive pinch-to-zoom actions on mobile devices. These behaviors often indicate confusion or frustration. -
Leverage Smart Analytics
Tools like Google Analytics (for tracking numbers), and Air360 (for all digital experience analysis using heatmaps, session recordings and user journey insights), or Hotjar (for heatmaps and session recordings), Mixpanel (for user journey insights), and Contentsquare (for visual engagement analysis) can reveal where users struggle. -
Address Specific Friction Points
For instance, a fintech company noticed users rage-clicking on credit card logos that were mistakenly perceived as payment options. By redesigning this element, they achieved a 7% boost in conversion rates [31].
"Choosing the right UX metrics and what to measure is a matter of paying attention to what's working and what's not - for the users and the business."
– Thais Souza, Design Director at PayFit [1]
To improve task completion, focus on:
-
Simplifying navigation for smoother user flows
-
Reducing mental effort with clear, concise instructions
-
Offering instant feedback on user actions
-
Experimenting with design tweaks to find what works best
-
Tackling emotional barriers that may cause hesitation
Conclusion: Using UX Data to Increase Sales
Key Takeaways
Investing in UX pays off big time - every $1 spent can bring in $100, delivering an impressive ROI of 9,900% [32]. UX metrics reveal both user engagement (like bounce rates and session duration) and areas where users drop off (such as task completion rates and cart abandonment).
| Metric Type | Business Impact | Key Focus Area |
|---|---|---|
| Performance Metrics | Tracks user behavior | Bounce rate, session duration |
| Self-Reported Metrics | Highlights user feedback | Task completion, satisfaction |
| Business Metrics | Measures financial impact | Conversion rate, revenue |
Understanding these metrics helps businesses identify what’s working and what needs improvement, leading to more consistent revenue growth.
How to Start Using UX Metrics
Thais Souza, Design Director at PayFit, emphasizes that UX KPIs should clearly connect what’s being measured to why it matters and how it impacts business success [1].
Here’s how to make UX metrics work for you:
-
Focus on Core Metrics: Choose 2-3 key UX KPIs that align with your business goals [29].
-
Tie Metrics to Business Goals: Show how UX changes directly impact revenue and other business outcomes [1].
-
Use the Right Tools: Combine platforms like Google Analytics for data tracking with tools like Air360 for user behavior insights.
"The best way to report a UX KPI to non-design executives is by connecting the UX KPI to a business KPI... The difference between a good designer and a great designer is the ability not only to solve problems but also to explain how the design is solving those problems and how the solution will help the company's goals." - Thais Souza, Design Director at PayFit [1]